WORK / EDUCATION AND POLICY
Hundreds of thousands of answers, one page you can read
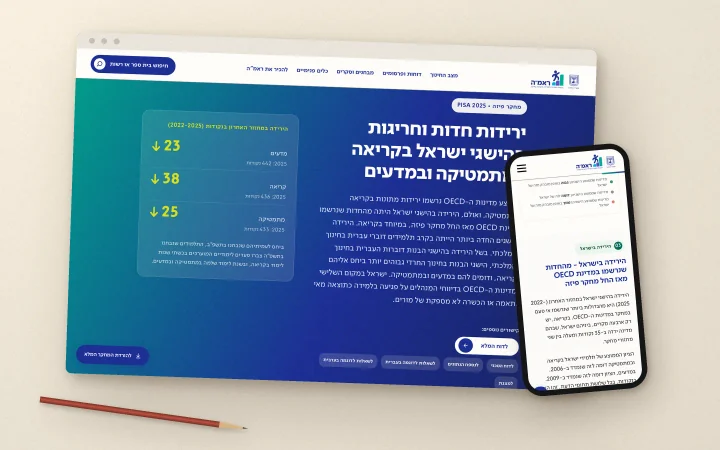
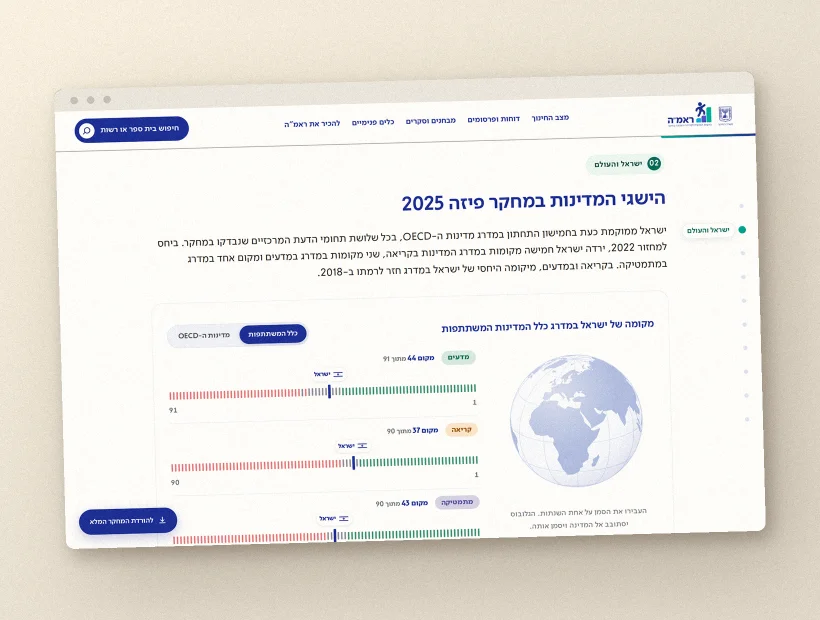
A results site for the international assessment, in Hebrew and English. Information architecture, design, data visualisation and full build.
WORK / EDUCATION AND POLICY
PISA 2025
An international assessment produces a mountain of data. We built the place you can stand on it and see something.
- CLIENT
- PISA 2025
- FIELD
- Education and policy
- YEAR
- 2026
- WHAT WE DID
- Research, information architecture, design and data visualisation
- BUILT IN
- Webflow
- LANGUAGES
- Hebrew and English
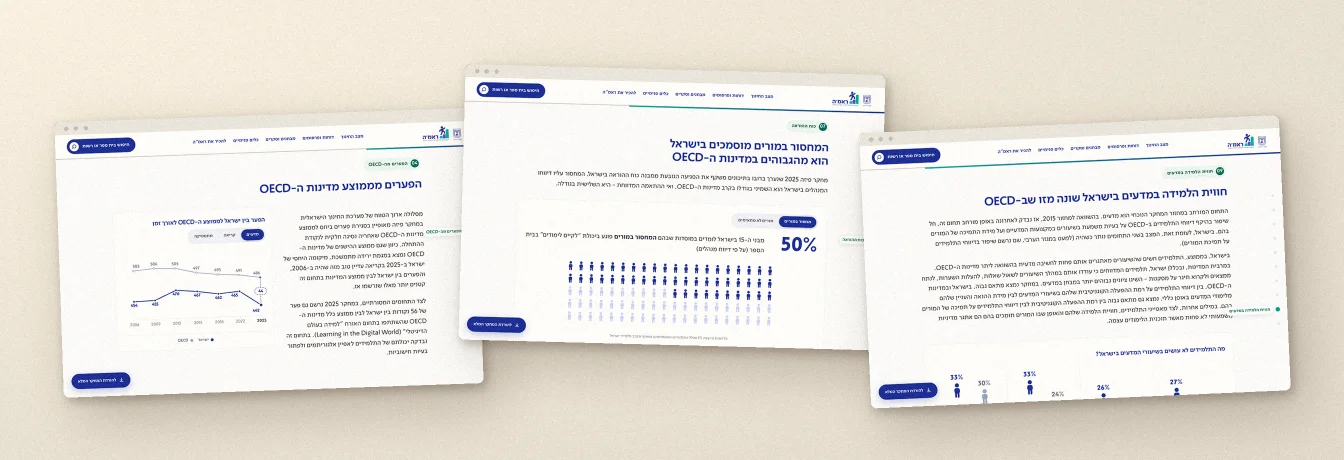
Screens
The challenge
International assessment results arrive as heavy data files: dozens of variables, hundreds of thousands of answers, and a whole classification system nobody outside the field knows.
But the people who need to understand them are rarely statisticians. They are a head teacher who wants to know where her school stands, a journalist writing about it tomorrow morning, and a parent who caught a headline on the radio.
The real question was never how to show all of the data. It was what you are allowed to leave out without lying.
If a chart needs a paragraph to explain itself, the chart has not worked
- 01Understand who is readingWe started from the questions people actually ask when results are published, not from the shape of the file we were handed.
- 02Choose what to showEvery measure that stayed on the main page had to earn its place. What did not earn it moved to a page of its own.
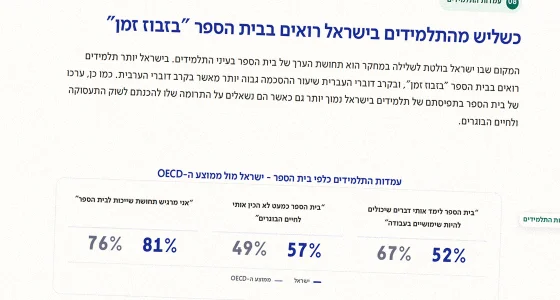
- 03Draw charts that read themselvesEach view carries its own title, units and range, with nothing to explain it.
- 04Build in WebflowSo the team can update content themselves, without coming back to us for every correction.
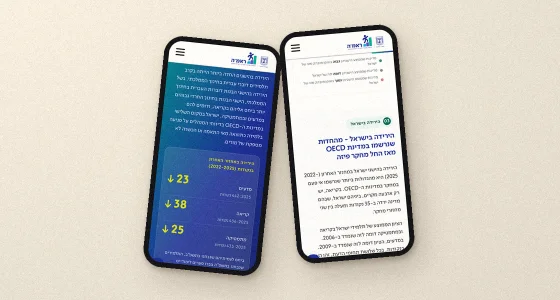
- 05Test in both languagesHebrew and English run in opposite directions. Every view was rebuilt for both, not simply translated.
The full data view
- 2Languages
- AAAccessibility
What we built it with
- Webflow
- Figma
- D3
- WCAG 2.1 AA
What was hard
The temptation on a project like this is to show everything. Every measure you drop is an argument with someone who cares about that measure, and we did not win all of them.
The second was direction. A chart that works in Hebrew does not automatically work in English, and the answer was not to mirror it but to rethink how it is read.
We would like to hear
Tell us what's stuck
One line is enough. You get an opinion back, not a generic quote.